Debugging is a skill that every developer should know, and even be good at. Whether you are developing a tiny application or a huge one, it is difficult to avoid errors while writing code. That is where debugging skills come into play.
If you use Android Studio , Xcode or Visual Studio … to develop applications, setting breakpoints when debugging is very simple.
But with applications like Node.JS , ReactJS, Vue… that use Visual Code to write, especially applications that use TypeScript as a programming language, you will encounter a bit of difficulty.
In this article, I will show you how to set up a development environment with VS Code for easy debugging.
To make it easier for you to visualize, we will proceed from creating the project to debugging typescript.
Create a new NodeJS project
Create a folder to contain the project source code, name it “vscode-typescript-debugging”.
Then create a src folder and add a “ app.ts ” file with the following content:
import { hello } from './hello';

class App {
    /** Entry point of our app */
    public static start() {
        console.log(hello('world'));
    }
}

App.start();
Add a file “ hello.ts ” still in the src folder
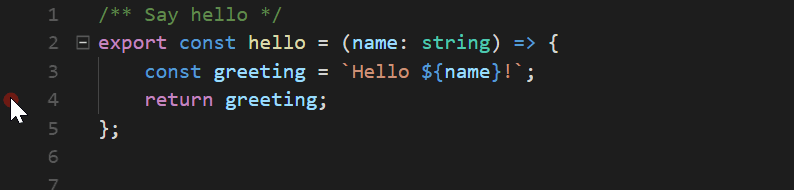
/** Say hello */
export const hello = (name: string) => {
    const greeting = `Hello ${name}!`;
    return greeting;
};
For this article, our project only needs to be like that, no need to be too complicated.
TypeScript compiler
After creating the project, the next step is to compile the TypeScript code into javascript code. Remember, browsers only understand 3 languages: HTML, CSS and Javascript. Therefore, no matter what language you write your application in, you will eventually have to compile it into these 3 languages.
In the main directory of the project, you add the configuration file “ tsconfig.json ” with the following content:
{
    "compilerOptions": {
        "outDir": "./out",
        "rootDir": "./src",
        "sourceMap": true,
        "moduleResolution": "node",
        "target": "es5"
    }
}
These are the most basic options for the TypeScript compiler. If you need to configure more options, you can refer to the official documentation here .
The key point in the above configuration is that you must enable the sourceMap option to true. The sourceMap files are created to map TypeScript to Javascript when debugging.
Note: If you have installed TypeScript globally using the command: npm i -g typescript , you can use the command tsc to compile typescript code. The command tsc will compile typescript code according to the options in the tsconfig.json file into a javascript file and save it to the out folder .
NPM-Scripts
Next, we create a “package.json” file , which is a common configuration file for the entire project. All Node.JS projects need to have this file.
How to create package.json file using command as follows:
npm init –yesThen we install Typescript for the project
npm install typescript --save-devThe contents of the package.json file will be as follows:
{
  "name": "vscode-typescript-debugging",
  "version": "1.0.0",
  "devDependencies": {
    "typescript": "^2.7.2"
  },
  "scripts": {
    "start": "node out/app.js",
    "prestart": "npm run build",
    "build": "tsc"
  }
}
I will briefly explain the content in the scripts tag. This tag is for us to define npm commands. For example, above, the tag "start" means when you type: npm start. The program will execute the corresponding command: node out/app.js (this is the command to run the application). The same goes for other tags like “prestart“, “build“.
Run Node application
Open a command window in the project directory and type the command:
npm startOK, so the program is running, now you want to debug it, what do you do? Please see the next step.
Debugging Configuration
Still in the project folder, create another folder “.vscode” and add a file ‘launch.json” with the following content:
{
    "version": "0.2.0",
    "configurations": [
        {
            "type": "node",
            "request": "launch",
            "name": "Build Project",
            "program": "${workspaceFolder}/src/app.ts",
            "preLaunchTask": "npm: build",
            "sourceMaps": true,
            "smartStep": true,
            "internalConsoleOptions": "openOnSessionStart",
            "outFiles": [
                 "${workspaceFolder}/out/**/*.js"
           ]
        }
    ]
}
Note: In many cases, when you switch to the debug tab on Visual Code, if you have not created a launch.json file, VS Code will automatically create it for you.
I will briefly explain the configuration content above:
program: the main file address of the application. Here is the app.ts filepreLaunchTask: call the build command in package.json, I understand that before running the application, we need to compile typescript into javascript.sourceMaps: true, that is, use the sourcemap in the “out” directory.smartStep: true, which means to ignore “uninteresting” code in the debugger (e.g. compiled JS-files)internalConsoleOptions: Open debug console when starting debugging.outFiles: Where the debugger looks for sourcemaps files.
Ok, so we have finished the configuration, now to debug typescript, you do as usual, set a breakpoint and run the program to call the line of code you just set the breakpoint on.
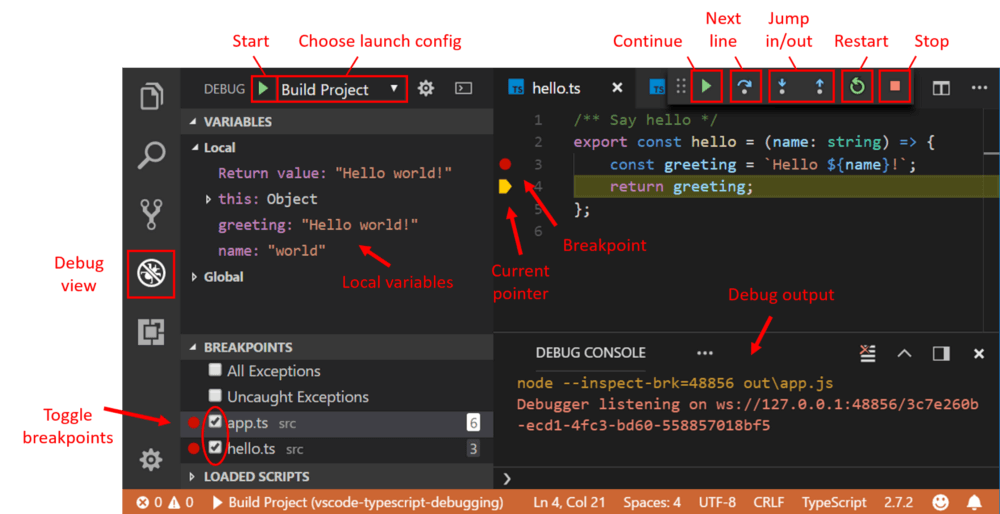
Conditional Breakpoints
I just want to add that you often use conditional breakpoints when you need to debug loops. Do you want to keep pressing F8 to skip this iteration, and wait for the iteration you want? What if the loop has thousands of steps? This is when conditional breakpoints are needed.
With conditional breakpoints, you can use “Expression” or “Hit Count” as the condition.
- Expression : Same as if conditional statement, if expression returns true then breakpoint there.
- Hit Count : Number of times that line of code is called until the hit count is reached, then the breakpoint stops.
Conclusion
VS Code is actually a small but extremely powerful Text Editor, providing a lot of options for you to develop projects, especially projects related to Javascript.
I hope this typescript debugging tutorial will be useful to you.
You can also view the working source for all the examples here on Github.