AWS X-Ray is an application performance management service that empowers developers to conduct performance analysis and debug applications in the AWS console.
In this blog, we are going to cover everything that you need to understand about AWS X-Ray:
Overview
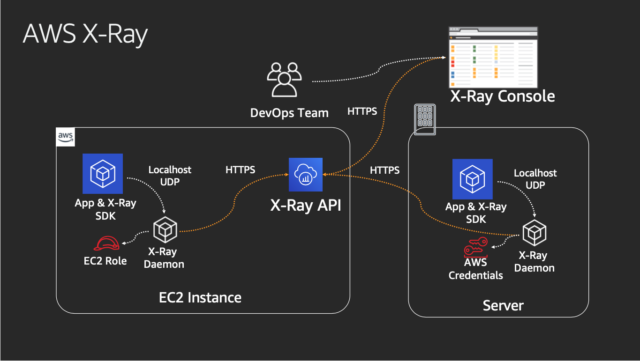
AWS X-Ray allows the developer to analyze and create a service map that displays an application’s architecture, including relation to components and a dependency tree. With the help of AWS X-Ray, we can understand how our application and its fundamental services are performing to identify and debug the root cause of performance issues and errors. AWS X-Ray provides end to end view of requests as they travel through your application.
AWS X-Ray SDK provides:
• Interceptors to add to your code to trace incoming HTTP requests
• Client handlers to instrument AWS SDK clients that your application uses to call other AWS services
• An HTTP client to use to instrument calls to other internal and external HTTP web services

Note: Check Our Blog on AWS SNS for an overview.
It uses trace data from your AWS resources that power your cloud applications to make a point-by-point detailed service graph. The service graph shows the customer, your front-end service, and backend services that your front-end service calls to handles requests and persist data. The use of the service graph is to improve the performance of your applications.

Note: Check Our Blog on AWS Storage for an overview and the types of storage options offered.
How does AWS X-Ray work?
It operates in the following workflow that progresses as follows:
- Collect Traces: AWS X-Ray gathers data from each fundamental service of an application.
- Record Traces: It combines all the data gathered from each service into singular units called traces.
- View Service Map: It generates a map of services used by your application using the trace data. This provides a visual representation of the trace data such as latencies, HTTP status, and metadata for each service.
- Analyze Issues: After all the traces are gathered and formated into a service map, developers are now able to identify the performance, unusual behavior of the application, and root issues.

Also Check: Our Blog post on AWS Secrets Manager
Features
The features of AWS X-Ray are:
- Simple Setup: It can be used with various applications running on Amazon EC2, Amazon ECS (Amazon EC2 Container Service), AWS Elastic Beanstalk, AWS Lamda. The process to get started with AWS X-Ray is very easy. We just have to integrate our application with X-Ray SDK and install the X-Ray. With Amazon EBS (Amazon Elastic Beanstalk) we just have to integrate the X-Ray SDK with our application as an X-Ray agent is pre-installed on Amazon EBS.
- End-to-end tracing: It provides an end-to-end view of requests made to our application. It gives you an application-driven view of requests flowing through your application by accumulating the data gathered from individual services in your application into a single unit called a trace.
- Service Map: It creates a map of services utilized by our application with trace data that we can use to identify errors and issues.
- Server and Client-side latency detection: X-Ray allows us to visually detect node and edge latency distribution directly from the service map. With this, we can quickly identify issues affecting our application and end-user. It helps us to understand the performance of the application.
- Data annotation and filtering: AWS X-Ray allows you to add annotations to data emitted from specific components or services in your application.
- Console and programmatic access: We can use X-Ray with AWS Management Console, AWS CLI, AWS SDKs. The X-Ray API enables us to programmatically access the service so we can easily export trace data.
- Security: It is integrated with AWS IAM (AWS Identity and Access Management) so that we can control which users and resources have permission to access our traces.

Also Read: How AWS Certificate Manager Works.
Pricing
In AWS X-Ray there are no upfront fees or commitments. We only pay for what we use. The topmost size of a trace is 500 KB. Trace data is stored for 30 days from the time it is recorded at no additional cost.
Free Tier
The first initial 100,000 traces recorded every month are free.
The first initial 1,000,000 traces received or scanned every month are free
Additional Charges
After Free Trial, traces recorded cost $5 for every 1,000,000 transactions
After Free Trial, traces received or scanned only cost $0.50 for every 1,000,000 transactions.
AWS X-Ray Console
The AWS X-Ray console has two main features:
- Service Map
- Traces
Service Map: Service Map provides the vision of connections between services and your application and collects data for each service, including average latency and errors. It allows you to quickly understand the connection and interchange between individual services that make up your application.

Traces: The Traces view shows a list of individual traces. It is utilized to discover traces by URL, response code, or other data from the trace summary. This allows us to analyze all the activity in our applications.

Note: Read our blog on AWS lambda.
Benefits
- Review request behavior: X-ray traces user requests as they travel through your entire application. We are able to get an end-to-end view of how our application is proceeding as this request aggregates the data generated by various services and resources in your application.
- Ready to use with AWS: It works with Amazon EC2, EC2 Container Service, Lambda, and Elastic Beanstalk.
- Detect application issues: with an X-ray, you can obtain insights into how your application is performing and find root causes for any issues. With X-ray’s tracing feature we can find where are the issues causing performance dips in your application.
- Improve application performance: X-ray helps you identify performance bottlenecks. The service map feature helps you see the relationship between resources and services in your application. You can look down into specific services and paths that are affecting application performance by detecting where high latencies are occurring.

Check Out: Our blog post on AWS 5 Pillars.
Frequently Asked Question
Q1. What is the X-Ray agent?
Ans. The X-Ray agent gathers data from log files and sends them to the X-Ray service for assembling, analysis, and storage. The agent makes it simple for you to send data to the X-Ray service, rather than using the APIs directly, and is available for Amazon Linux AMI, Red Hat Enterprise Linux (RHEL), or later operating systems.
Q2. Does X-Ray provide an API?
Ans. Yes, X-Ray provides a set of APIs for ingesting request data, querying traces, and configuring the service. You can utilize the X-Ray API to build analysis and visualization applications.
Q3. How long does it take for trace data to be available in X-Ray?
Ans. Trace data sent to X-Ray is generally available for retrieval and filtering within 30 seconds of it being received by the service.
Q4. Is AWS X-Ray free?
Ans. There are no upfront fees or commitments. You pay only for what you use, based on the number of traces recorded, retrieved, and scanned.