
Debugging is used to detect and fix faults in programs, preventing them from performing incorrectly after being deployed to production. When there are several tightly-connected modules, debugging becomes even more complicated since each change made in one module may cause errors in another.
Developers can debug Go applications with the Visual Studio Code editor. With the required debugging extensions, the VS Code editor provides outstanding tools for debugging Go programs. In this article, we’ll learn how to debug Go applications using the VS Code editor.
Prerequisites
To complete this tutorial, you’ll need the following:
- Go installed on your system
- Basic understanding of the Go programming language
- VS Code v1.63 installed on your computer
- Go and Delve extensions installed in your VS Code editor
What are debugging tools?
Debugging is the process of detecting, finding, and solving defects or problems in a software application. It’s like being the detective in a crime movie while simultaneously being the murderer.
Debugging tools help you closely spot these errors while executing the code so you can remove or fix them, helping you go step-by-step or line-by-line of your code to find them. These errors often include syntax, semantic, and run-time errors.
Using a debugging tool and pausing the execution while you follow the line of code as it executes is one reason why developers have opted to use them. It is the only way you can fully and quickly grasp what is going on in your codebase.
Using this tool, you can immediately see what happens. It is also a great learning method because you actually see how the computer interprets the code.
Debugging techniques
Let’s look more at some common debugging techniques in Go to quickly check for errors in your code.
Using print
This is a practice of adding extra print statements to your code so you can see what logs to your console. With this, you can see the values of variables, how expressions execute, and check whether you’re reaching variable scopes or not.
There is a lot to see but this depends on what you need logged to your console.
However, this is a good trick if you do not use any debugging tools. One advantage of using print is that you can see the flow of your variables and statements on the go.
But, if you build a large-scale application with a lot of functionalities, there is no better surrogate than having a logging system in your codebase.
Also, using print can be messy, convoluting the readability of your codebase with print typed everywhere. They can become too much if you forget to remove them as you find the errors and you cannot turn print off.
Using a debugger
Most IDEs have a built-in debugger that can help detect errors in your code. It is another quick way to debug your code after using print. Debuggers are only found in IDEs, like Visual Studio Code or Eclipse.
Using a debugger helps discover breakpoints, moving line-by-line in your code watching variables flow. With these, you can find logical errors quickly.
Most developers call this technique the step-by-step execution because it moves from line to line and is a quick way to detect bugs.
But while using a debugger is still one of the most preferred techniques for debugging, using the debugger can be tedious in very large applications, which is why I personally prefer using logs, that is, writing log messages to standard output.
Using error detection tools
These tools can help find any breach of errors based on their type. This means there are certain types of error classes these tools can find, such as memory leaks by detecting memory errors.
These tools are also regarded as error monitoring tools because they mainly give the ability to visualize the error to understand what happened and where it happened.
Other common techniques for debugging include backtracking and divide-and-conquer.
Go Debugging tips
Understand your debugger
If you want to use a debugger like Delve, ensure you understand how it works; learn its commands, how to set breakpoints, and other basics for using the debugger. With this in my mind, you can approach bugs with those tools effectively.
Think about debugging while coding
You should also have a logging system to quickly log information as you code. But, don’t forget to avoid logging sensitive information, like passwords or financial information.
Watch out for simple bugs
Avoid thinking about the worst scenario; your bug might be simple, such as having a wrong spelling somewhere or using the wrong variable name. It’s always the least expected thing.
Go debugging tools
With our understanding of debugging and debugging methods, let’s review some Go debugging tools that can be helpful when working in Go. These tools should give you better insight as to why development is a lot easier when you use them.
Delve
The first and most common debugger for Go is Delve. The goal of using Delve is to provide a simple and full-featured tool for debugging in Go.
One cool thing about Delve is that it was built from the ground up as a debugger for Go, so the actual target for this tool is the Go programming language, unlike other debuggers in IDEs that can be used for various languages.
This is extremely helpful because it knows how to tackle Go-specific features and functionalities like Goroutines, syntax expressions, data structures, and runtime.
To get Delve, you must install it on your computer.
Installing Delve
Delve supports all platforms, including Linux, Windows, and macOS.
Installation is the same for macOS, Windows, and Linux, and all you need to do is use the go install command:
$ go install github.com/go-delve/delve/cmd/dlv@latestAfter this finishes installing, you can run go help to check where the dlv saved.
If on macOS, you must also install the developer tools to use Delve:
$ xcode-select --installBelow are a few of Delve’s commands to use while debugging:
       --accept-multiclient               Allows a headless server to accept multiple client connections.
      --allow-non-terminal-interactive   Allows interactive sessions of Delve that don't have a terminal as stdin, stdout and stderr
      --api-version int                  Selects API version when headless. New clients should use v2. Can be reset via RPCServer.SetApiVersion. See Documentation/api/json-rpc/README.md. (default 1)
      --backend string                   Backend selection (see 'dlv help backend'). (default "default")
      --build-flags string               Build flags, to be passed to the compiler. For example: --build-flags="-tags=integration -mod=vendor -cover -v"
      --check-go-version                 Checks that the version of Go in use is compatible with Delve. (default true)
      --disable-aslr                     Disables address space randomization
      --headless                         Run debug server only, in headless mode.
  -h, --help                             help for dlv
      --init string                      Init file, executed by the terminal client.
  -l, --listen string                    Debugging server listen address. (default "127.0.0.1:0")
      --log                              Enable debugging server logging.
      --log-dest string                  Writes logs to the specified file or file descriptor (see 'dlv help log').
      --log-output string                Comma separated list of components that should produce debug output (see 'dlv help log')
      --only-same-user                   Only connections from the same user that started this instance of Delve are allowed to connect. (default true)
  -r, --redirect stringArray             Specifies redirect rules for target process (see 'dlv help redirect')
      --wd string                        Working directory for running the program.
Debugging with Delve
To start a debugging session in Delve, run the command below to compile your program:
$ dlv debugThe dlv debug compiles and runs the main package in the current directory for debugging. You can also specify the package after the command, such as using dlv debug ./hello:
# run delve
$ dlv debug ./hello
Type 'help' for list of commands
(dlv)
To know more about using Delve, you can always use the help command.
Delve drawbacks
Delve has become more stable and mature over the years because it is was quite uncomfortable to use at its inception. The only drawback of using Go Delve is that it does not have a simple tutorial for using the commands.
Creating a sample app
For a better grasp of how the VS Code debugger works, let’s create a basic Go application that generates a JSON output from an array. To create the new Go program, open your terminal and run the commands below:
mkdir go-debugging
cd go-debugging
go mod init github.com/USERNAME/go-debugging
touch cmd/go-debugging/main.go
In the command above, change USERNAME to your personal GitHub username. Open the main.go file and add the following code using your VS Code editor:
package main

import (
   "encoding/json"
   "fmt"
   "log"
)


type user struct {
   FullName string `json:"full_name"`
   Email string `json:"email"`
   Gender   string `json:"gender"`
   Status   string `json:"status"`
   RegDate   string `json:"Reg_date"`
}


func main() {
   userinfos := []user{
       {
           FullName: "blessing james",
           Email: "blessing@gmail.com",
           Gender:   "Male",
           Status:   "active",
           RegDate:"20-01-2021",
       },
       {
           FullName: "matt john",
           Email: "matt@gmail.com",
           Gender:   "Male",
           Status:   "active",
           RegDate:"20-01-2021",
       },
       {
           FullName: "john peace",
           Email: "peace@gmail.com",
           Gender:   "Midgard",
           Status:   "active",
           RegDate:"20-01-2021",
       },
   }


   jsonBytes, err := json.Marshal(userinfos)
   if err != nil {
       log.Fatalln(err)
   }
   fmt.Println(string(jsonBytes))
}
The code above will print the array userinfos in JSON format. You can execute the application using the command below:
go run main.goThe output of the command above is in JSON format, as shown below:
[{"full_name":"blessing james","email":"blessing@gmail.com","gender":"Male","status":"active","Reg_date":"20-01-2021"},{"full_name":"matt john","email":"matt@gmail.com","gender":"Male","status":"active","Reg_date":"20-01-2021"},{"full_name":"john peace","email":"peace@gmail.com","gender":"Midgard","status":"active","Reg_date":"20-01-2021"}]Setting up a debugging session in VS Code
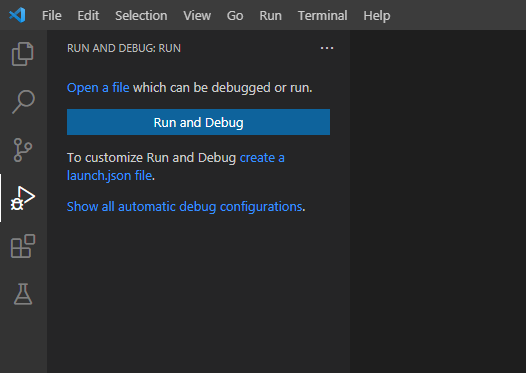
Setting up the debugging configuration in Go is pretty simple and straightforward. From your VS Code’s sidebar menu, click on the Run and Debug button, then click on create a launch.json file:
You’ll see a dropdown menu where you can select your workspace folder. Then, select Go for environment language. Finally, select Launch Package for debug configuration. This configuration will create the launch.json file, which will contain the following code:
{
// Use IntelliSense to learn about possible attributes.
// Hover to view descriptions of existing attributes.
// For more information, visit: https://go.microsoft.com/fwlink/?linkid=830387
"version": "0.2.0",
"configurations": [
{
"name": "Launch Package",
"type": "go",
"request": "launch",
"mode": "auto",
"program": "${fileDirname}"
}
]
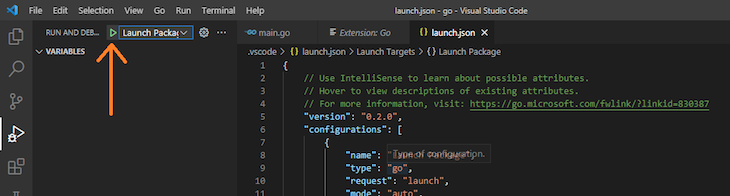
}Change the value for program in the JSON settings above to the application file name, main.go in our case:
"program": "main.go"After you save the launch.json configuration, the DEBUG CONSOLE at the bottom of the editor window will display your project’s output. The debug toolbar will appear at the top of the screen, allowing you to step through the code, pause the script, or end the session.
To debug the application, click on the play icon near RUN AND DEBUG, which will display the program output in the DEBUG CONSOLE window:
If you are run delve debugger extension for the first time, you will likely get an error, as shown below:
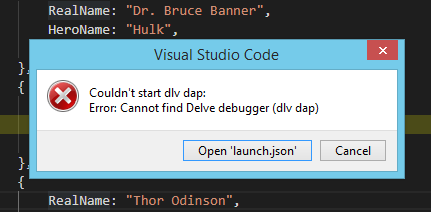
To resolve this error, in your terminal enter the command below and click on run and debug icon again:
Install -v githup.com/go-delve/cmd/dlv@latestDebugging using a breakpoint
A breakpoint allows you to inspect a line of code by pausing its execution. Breakpoints can be set practically anywhere in VS Code, including variable declarations, expressions, comments, and blank lines, with the exception of function declaration statements.
Let’s add breakpoints to lines 26, 29, and 35. Simply click to the left of the line number, and you’ll see a red dot appear:
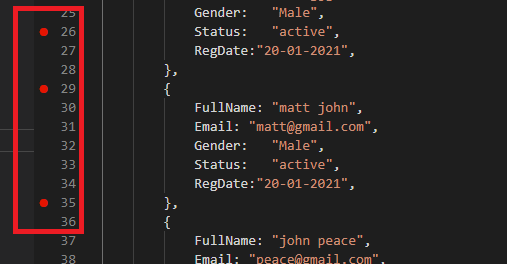
When you debug the program above, execution will pause at each breakpoint. First, the program will automatically pause on line 26. By clicking on the Continue button F8from the debug toolbar, the program will resume its execution until the next breakpoint is reached on line 29, then line 35.
Under the VARIABLES panel, we can inspect the current scope of each identifier by hovering over the line of the current breakpoint, marked in yellow.
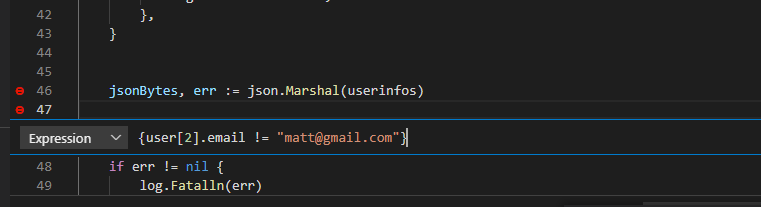
Using a conditional breakpoint
In VS Code, you can modify breakpoints by giving them an expression, usually a boolean expression, allowing you to inspect your program whenever certain expressions are true or false.
For example, we could add a conditional breakpoint that is raised only when the expression is true, as in user[2].email == "matt@gmail.com". To do so, right-click on the breakpoint and select Conditional Breakpoint:
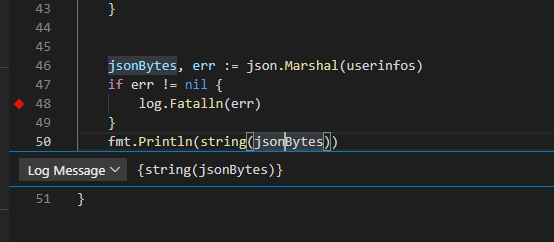
Using the logpoint
Instead of pausing the code execution and breaking into the debugger, the logpoint is a type of breakpoint that logs a message or value to the console, which is important for the debugging workflow.
To add and remove log() statements without changing the code, right-click the gutter and select Add Logpoint. In place of the red circle, the logpoint is represented by a red diamond-shaped icon. In the terminal, you’ll see a text input field; to log an expression or variable’s value, put it in curly brackets:
Inspecting our code execution
At the top of the VS Code editor, you’ll see the debug toolbar, which contains directions for effectively navigating the debugger. Let’s review these one by one:
Continue F8
You can use the continue F8 button to resume the program’s execution when it pauses at a breakpoint. When debugging your Go program in VS Code, you can add as many breakpoints as you want.
Step over F10
The step over command F10 runs the line of code that is currently highlighted before moving on to the next line. You can use the step over command to advance down a function, fully comprehending how it is executed.
If you use the step over command on a line that calls a function, it will execute the whole function, pausing at the first line underneath the function.
Step into F11
Like the step over command, we can use the step into command to debug a program line-by-line. However, if the step into command encounters a function, the debugger will enter the function that was called, continuing to debug line-by-line from there.
Step out Shift+F11
The step out command continues the current function’s execution, pausing at the last line. For example, if you mistakenly type a function that has nothing to do with the problem you’re trying to address, you can use the step out command to quickly exit the function and return to the relevant part of your codebase.
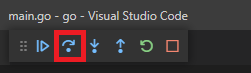
Restart Ctrl+Shift+F5
Whenever you wish to restart debugging a program that has hit a breakpoint, you can use the restart command to start debugging the program from the beginning instead of killing and relaunching the debugger.
Stop Shift+F5
Once you’ve finished debugging your program, use the stop command to exit the debugging session. When you connect to an external Node.js process, a disconnect icon will appear.
VARIABLES panel
Now that we’ve reviewed the functionalities available in the debug toolbar, let’s review the additional tabs in our VS Code editor. In the VARIABLES panel, you can see the values of variables and expressions that were evaluated at the breakpoint.
Additionally, by right-clicking on any of the values in the context menu, you can set Value, Copy Value, or Add to Watch for the variable.
WATCH panel
When the code is paused, you can bring the values that you want to monitor into view in the WATCH panel. Rather than having to go through the VARIABLES panel each time you want to check a value, you can add a deeply nested property to the WATCH panel for easy access.
This is especially useful for finding the values of numerous variables at once because they are all immediately recalculated during execution.
Debugging using unit testing
We can also use unit testing to debug Go applications; unit testing helps to ensure that each component of the application performs its intended function properly. Let’s look at how we can debug Gol application using unit testing in Visual Studio.
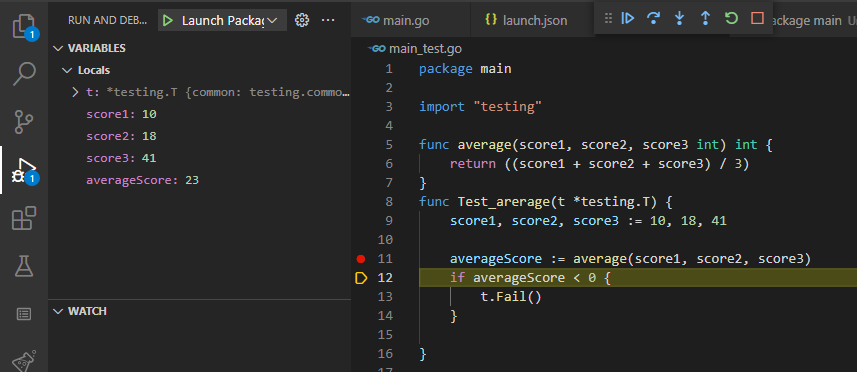
Create a test file named main_test.go and add the following code to the file:
package main
import "testing"
func average(score1, score2, score3 int) int {
return ((score1 + score2 + score3) / 3)
}
func Test_arerage(t *testing.T) {
score1, score2, score3 := 10, 18, 41
averageScore := average(score1, score2, score3)
if averageScore == 0 {
t.Fail()
}
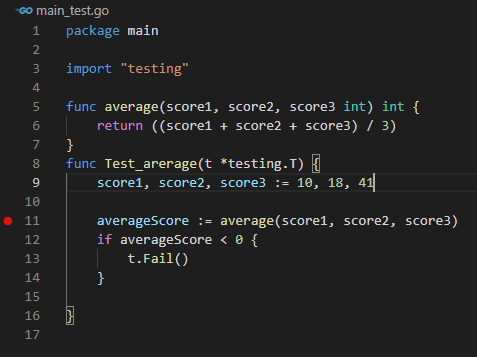
}The two functions above enable us to calculate the average value of three numbers. The function to be tested (Test_average) is preceded by the Test_ keyword. To run the unit test, enter the command below:
go testNow let’s debug our test file by adding a breakpoint to the program as shown below:
Now you can start the debugging session, then use the Debug Tool to step over and inspect each variable and change their value under the variables section.
Conclusion
In this article, we covered some of the fundamentals for debugging Go applications with Visual Studio Code. The VS Code editor offers helpful plugins that make debugging easy.
We can add breakpoints, conditional breakpoints, and logpoints to pause our code execution, allowing us to deeply inspect what went wrong. We also explored some of the shortcuts available in the debug toolbar, which allow us to navigate through our code during the debugging process. Lastly, we covered some of the functionalities in the VARIABLES panel and the WATCH panel.
To learn more, be sure to check out the online documentation. I hope you enjoyed this tutorial! Please leave a comment if you have any questions.
Download Source Code
$ git https://github.com/favtuts/golang-tutorial-beginners.git
$ cd go-debugging