A container orchestration tool like Kubernetes helps in automating deployment, scaling, and management of containerized applications. While Kubernetes has the potential to simplify the act of deploying the application in containers, it comes with a challenge how does one monitor such a tool? There are so many points to keep track of.
Are you new to Kubernetes? Check out our blog on Kubernetes for Beginners.
What is Monitoring in Kubernetes?
The move from monolithic to a microservice architecture, adopting Kubernetes means you have got to monitor many smaller components. The monitoring in Kubernetes gives us insight into our cluster’s current health, including metrics of Nodes and Pods running, resource utilization, and a top-level overview of what’s happening inside your Kubernetes cluster.
To scale an application and supply reliable services and resources to it running in a Kubernetes cluster, you would like to know insight into how the application behaves when deployed. It’s critical to examine the performance of containers, pods, and services. Monitoring helps in getting this information and helps to boost the performance of the application.
Also, check our blog post on Kubernetes Architecture.
Monitoring K8s involves monitoring the cluster, all the nodes, as well as monitoring pods, deployments, and services. These can be divided into two main components:
1. Kubernetes Cluster Monitoring
In the monitoring of the cluster, the target is to monitor the health of the whole Kubernetes cluster. As an Administrator, it helps in discovering if all the nodes within the cluster are working properly and at what capacity and what percentage of application are running on each node, and also the resource utilization of the complete cluster.
Here are a number of useful metrics for each:
- Node resource usage: These metrics are associated with resource utilization. It involves metrics like CPU, disk, and memory utilization, network bandwidth, and many more. These metrics help us to make a decision if we wish to extend or decrease the number and sizes of every node within the cluster.
- The number of nodes: The nodes available are a crucial metric to follow, it helps us to work out whether the number of nodes available has sufficient resources and if could handle the workload just in case a node fails and also what you’re paying for if you’re using cloud providers.
- Running pods: The running pods in a cluster helps to work out resource utilization like CPU, memory, disk, etc. by the pod. It helps in scaling them accordingly when required based on resource utilization.
Also Read: Our blog post on Configmap Kubernetes. Click here
2. Kubernetes Pod Monitoring
Pod-level monitoring involves watching three forms of metrics: Kubernetes metrics, container metrics, and application metrics.
- Kubernetes metrics: Kubernetes metrics help you ensure all pods in a deployment are running and healthy. They provide information on what number of instances a pod currently has and how many were expected. It’s also important to know how your deployment is progressing, as well as tracking network throughput and data.
- Container metrics: Container metrics help you determine how close you’re to the boundaries you’ve configured. You’re fascinated by monitoring metrics like CPU, memory, and network usage. They also allow you to detect containers stuck in a CrashLoopBackoff.
Note: CrashLoopBackoff implies that you that your pod is starting, crashing, starting again, and then crashing again. It generally occurs when – The application inside the container keeps because of the scarcity of resources.
- Application metrics: Application metrics measure the performance and availability of applications running inside your Kubernetes cluster and are usually exposed by the applications themselves. The available metrics rely on the business scope of every application. Say you use a database application, then you’ll likely have an interest in data associated with tables, relationships, and indices state.
Check this out: Since Kubernetes is the most ‘hot & trending‘ in the containerization world, most of the IT professionals are Kubernetes certification aspirants because of the undisputed value it holds. Let’s come to the good news, Certified Kubernetes Administrator (CKA)
Kubernetes Metrics Server
For monitoring in Kubernetes, K8s has a built-in monitoring tool Metrics Server. Metrics Server is a cluster-wide aggregator of resource usage data. It collects metrics like CPU or memory consumption for containers or nodes, from the cAdvisor exposed by Kubelet on each node. Metrics Server is a scalable, efficient source of container resource metrics for Kubernetes built-in autoscaling pipelines.

The metrics server stores all the retrieved information from the nodes and pods in memory. It’s an In-memory monitoring solution and does not store metrics on the disk as a result we cannot see historical performance data. Metrics API can be accessed by:
- kubectl top node which provides CPU and memory consumption of each of the nodes.
- kubectl top pod to look at the CPU and memory consumption of pods in K8s.
Kubernetes metrics server is used for Kubernetes advanced orchestration like Horizontal Pod Autoscaler for autoscaling. Metrics Server offers:
- A single deployment that works on most clusters
- Scalable support up to 5,000 node clusters
- Resource efficiency: Metrics Server uses 0.5m core of CPU and 4 MB of memory per node
Also read: Our blog post on High Availability in Kubernetes.
Other Kubernetes Monitoring Tools
With the increasing adoption of containers and microservices within the enterprises, monitoring utilities have to handle more services and server instances than ever before. Although the infrastructure landscape has changed, operations teams still need to monitor the identical metrics on CPU, RAM, File System, Network utilization, etc. For this, there are 3rd-party tools available within the market which helps in monitoring Kubernetes by collecting the logs, metrics in a much better way. Let’s observe a number of the favored open-source tools available.
Read This blog in which we provide you with an overview of Helm and Helm Charts description and why is it beneficial. If you are new to Kubernetes, it will be helpful to read Kubernetes Introduction and Its architecture first to familiarize yourself with the basics concept.
1. The ELK Stack
For Monitoring in Kubernetes, the foremost popular open-source monitoring tool is the ELK Stack. An acronym for Elasticsearch, Logstash, and Kibana, ELK also includes a fourth component — Beats, which are lightweight data shippers. Each component within the stack takes care of a different step in the logging pipeline, and together, all of them provide a comprehensive and powerful logging solution for Kubernetes.

Logstash is a log aggregator that captures and processes logs before shipping them to Elasticsearch. Elasticsearch was designed to be scalable and can perform well even when storing and searching across innumerable documents. Kibana provides reporting and visualization functionalities. And eventually, Beats, are lightweight data shippers used to send logs and metrics to Elasticsearch.
Pros:
- Rich analytics capabilities
- Easy to deploy and run in Kubernetes environment
- Large community
Cons:
- Challenges at scale
- Elasticsearch does not have multi-language support in terms of handling request and response data (only possible in JSON) unlike in Apache Solr, where it is possible in CSV, XML, and JSON formats.
2. Prometheus
Prometheus is one of the foremost popular open-source tools used for monitoring in Kubernetes. It was developed by SoundCloud and donated to the CNCF (Cloud Native Computing Foundation). Prometheus stands out as compared to other time-series databases – such as Cassandra, Graphite, InfluxDB – is that it has a simple yet powerful multidimensional data model and its flexible query language (PromQL). Furthermore, it follows a pull model rather than push and has built-in real-time alerting mechanisms.
Finally, being open-source, it gathered a large community interest in helping and bringing innovation. These differentiators make Prometheus a great solution for monitoring in Kubernetes.

Pros:
- Built-in monitoring and alerting
- Functional and reliable during outages
- Kubernetes-native, easy to use
- Integrates well with Grafana
- Large community
Cons:
- No long-term storage
- No dashboard
- No authentication/authorization
- Challenges at scale
Read this blog to know about what is Kubernetes Pod which is an important component of Kubernetes.
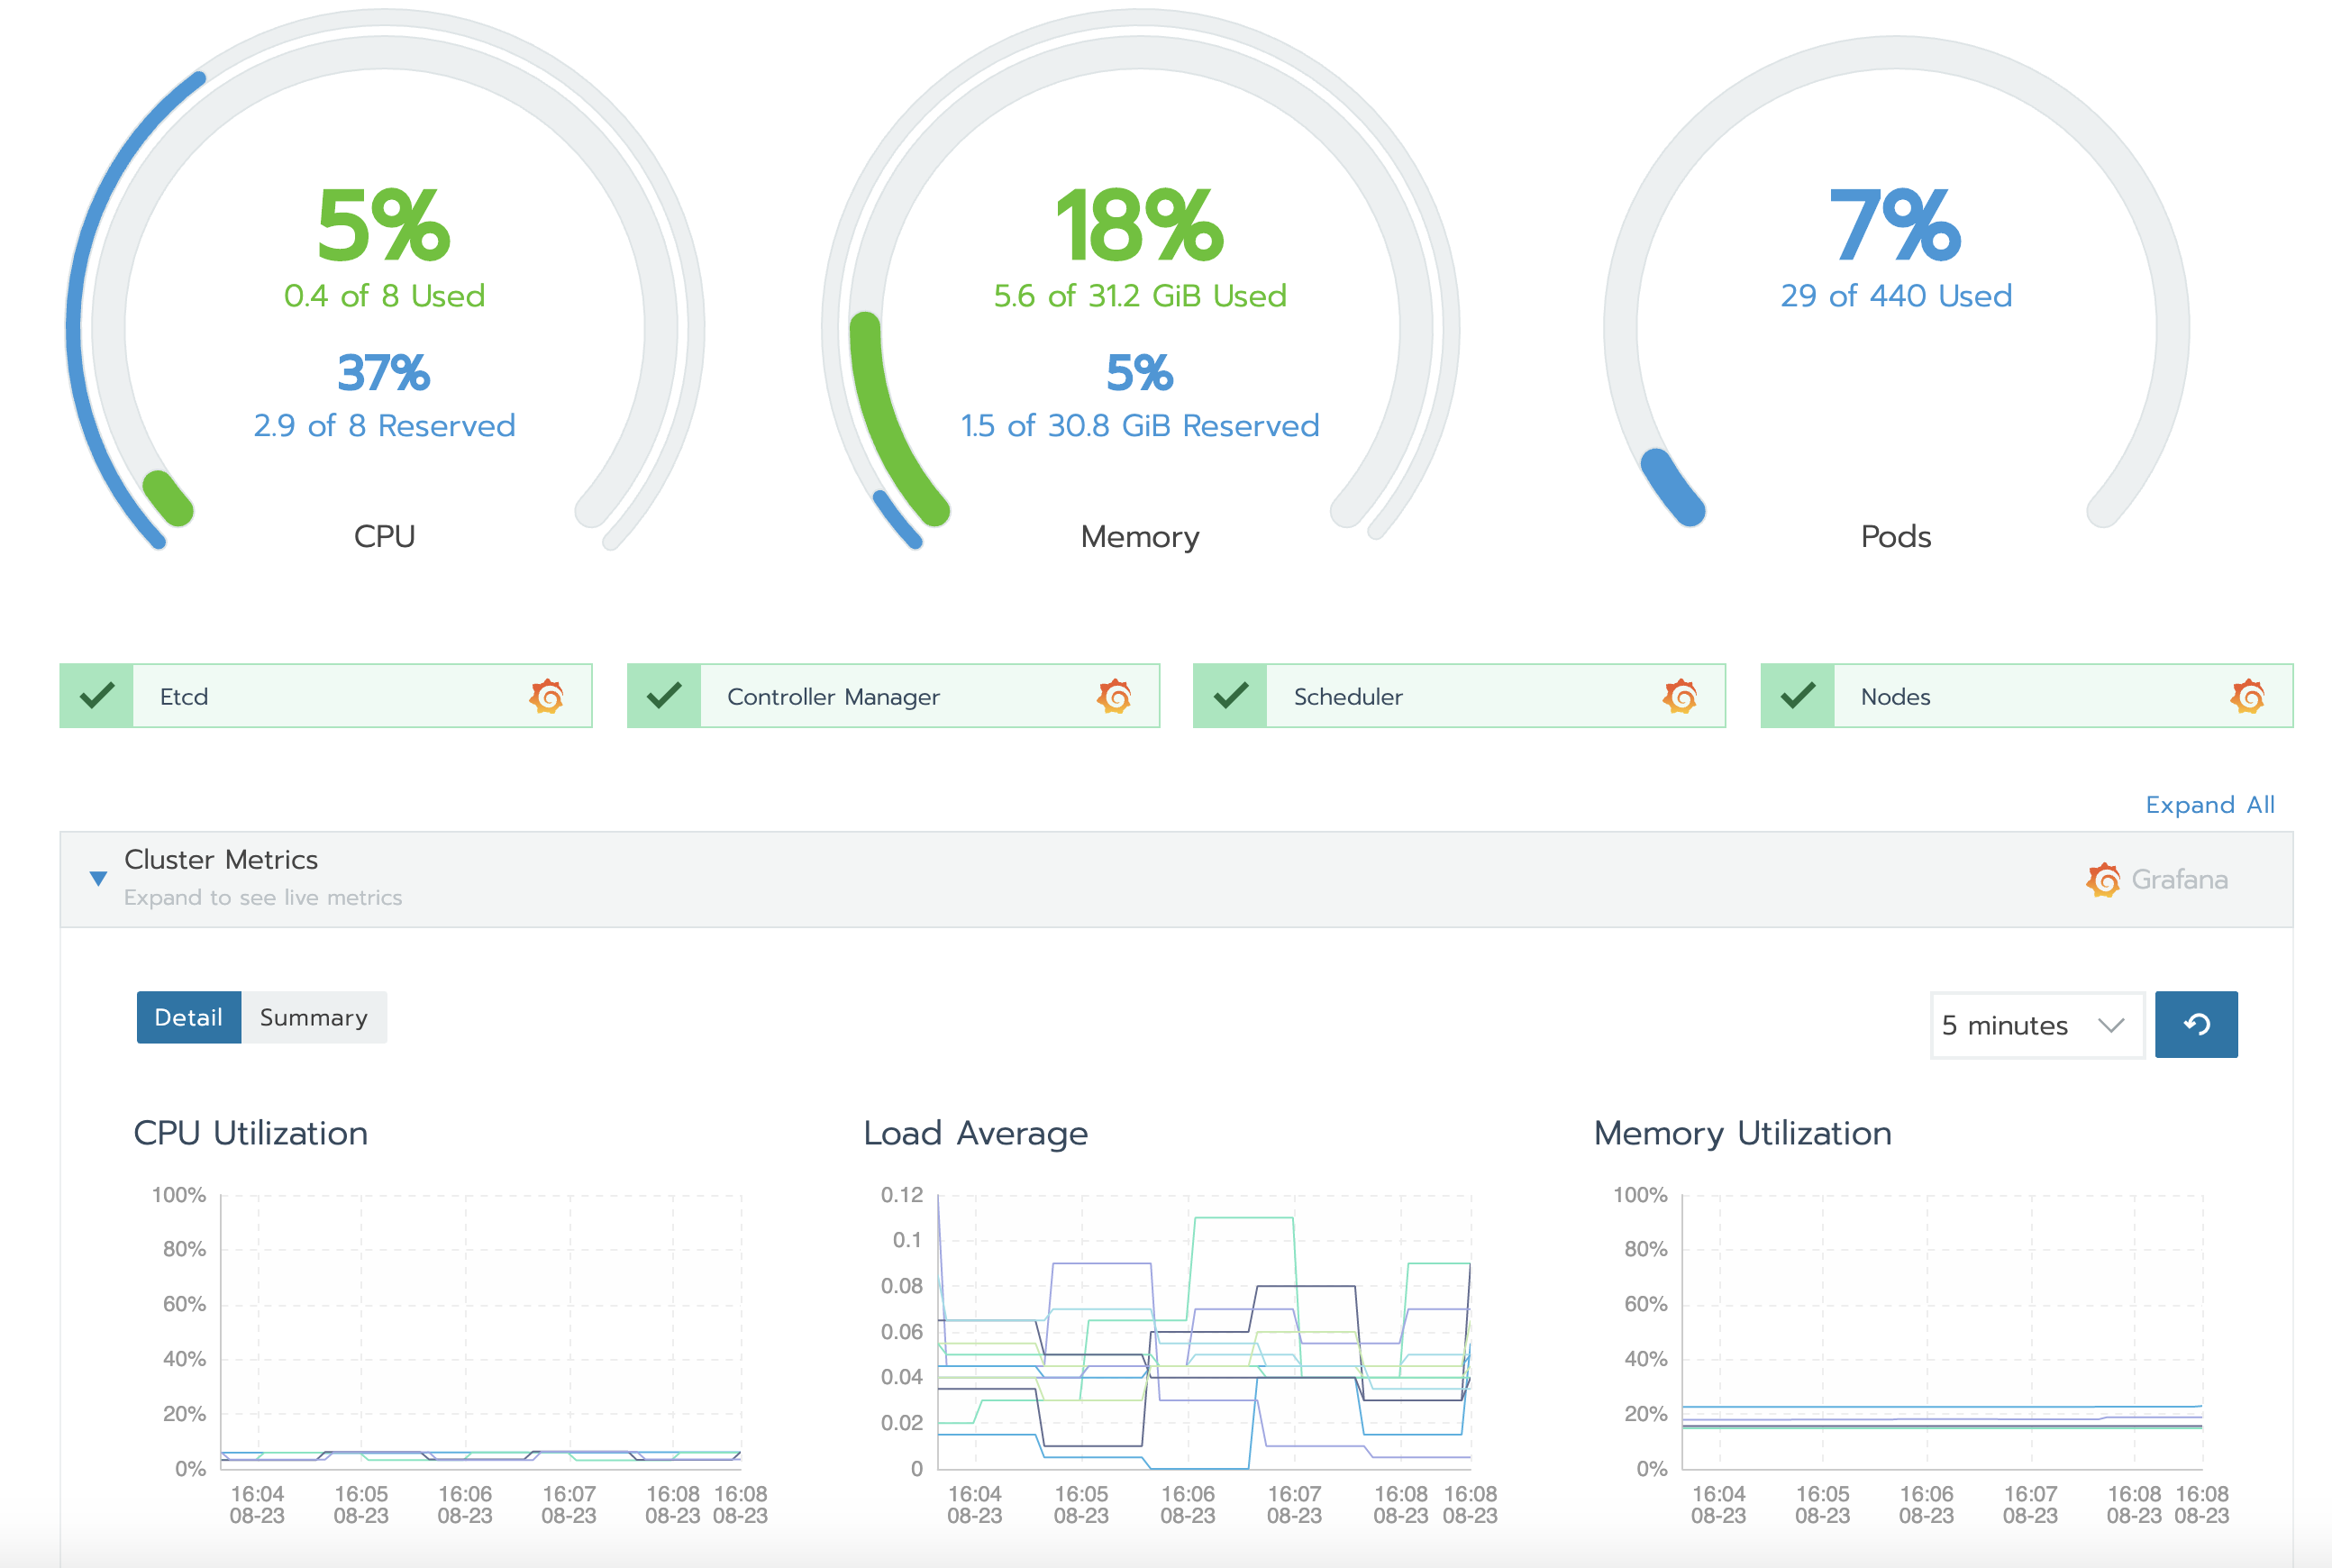
3. Kubernetes Dashboard
Kubernetes Dashboard is a web-based UI add-on for Monitoring in Kubernetes. It provides a simple way to manage, troubleshoot, and monitor your environment. You can use the Kubernetes Dashboard to see basic metrics related to memory and CPU usage statistics across all of your nodes and to monitor the health of workloads (pods, deployments, replica sets, etc.). You can also manage and take action from this dashboard, which has been a security concern on multi-tenant clusters as proper RBAC privileges need to be set up.

Pros:
- Easy to install
- Part of the Kubernetes ecosystem
Cons:
- Limited features
Note: Check out our blog post on Kubernetes RBAC
4. Datadog
Proprietary APM solutions like Datadog for Monitoring in Kubernetes enable you to extract logs, metrics, events, and service states from K8s in real-time. It enables you to monitor, troubleshoot, and optimize application performance. Datadog features dashboards and high-resolution metrics and events for manipulation and graphing. You can also set up alerts and receive notifications on various channels, including Slack and PagerDuty. Datadog is easy to install. You can run it using their DaemonSet agent that will be deployed to every cluster node.

Pros:
- Easy to install
- Great APM integration
Cons:
- Confusing logs integrations
- The performance or speed of information delivery tends to slow down when more applications are integrated with it.
Also Read: Our blog post on Certified Kubernetes Application Developer ckad, Everything you need to know before giving this exam.
5. Weave Scope
Weave Scope is a great tool for Monitoring in Kubernetes. It is a zero-configuration monitoring tool developed by Weaveworks. It generates a map of processes, containers, and hosts in a Kubernetes cluster to help understand Docker containers in real-time. It can also be used to manage containers and run diagnostic commands on containers without leaving the graphical UI.
If you are looking for a practical graphical tool to obtain a visual overview of your Kubernetes cluster—including the application, the infrastructure, and the connections among your cluster nodes—Weave Scope may help you. This tool is extensible via some plugins.

Also Read: Our blog post on best Kubernetes dashboard. Click here
Pros:
- Zero-configuration
- Provides a much nicer user interface
Cons:
- Lacks analytical depth