Kubernetes monitoring is a method of examining and reporting the health status of cluster components. So, the process helps track the utilisation of cluster resources, including memory, CPU, and storage. And, talking of open-source tools like Prometheus for Kubernetes monitoring and Grafana for visualising have become the numero uno go-to tools!
Kubernetes Monitoring

The challenge with Kubernetes comes from the managing of high availability, performance, and deployment of containers. But, what is more, the challenge is also to monitor them. Thankfully, K8s comes up with Metrics. The CAdvisor, installed by default on all cluster nodes, collects containers like CPU, memory, network, and disk usage. These metrics are pushed into the Metric Server of Kubernetes by the kubelet APIs.
Kubernetes eases the management of our containerised applications and services. It can sometimes be a two-edged sword, as it adds complexity to the system with the influx of new layers and abstractions. Hence, it makes a long list of components to monitor.
But to our rescue, there are many excelling open-source tools in today’s world to help us get through with the monitoring.
Kubernetes Dashboard
The web-based Kubernetes console, which is a general-purpose UI made to look after the Cluster in Kubernetes. Surprisingly, even the dashboard is nothing but a container that access the cluster information from within the cluster. So, it’s just another resource for Kubernetes to manage.

Also Check: Our blog post on Kubernetes Deployment. Click here
What is Prometheus?
An open-source monitoring tool, Prometheus seems to be the King 👑 of all the monitoring tools out there as of today. Prometheus on Kubernetes is used for metrics-based monitoring and alerting. It pulls the real-time metrics, compresses and stores them in a time-series database.
The Prometheus sends an HTTP request (pull) called Scrape, found on the configuration in the deployment. It provides a query language and a robust data model that provides detailed and actionable metrics.
Let’s look at how is Prometheus built from the inside.
Prometheus Architecture
At its core, Prometheus has a main component called Prometheus Server, responsible for the actual monitoring work. The Prometheus server consists of:
- Time Series Database that stores all the metric data like current CPU usage, memory usage etc.
- Data Retrieval Worker is responsible for all the data pulling activities from applications, services, servers etc. and pushing them into the database.
- HTTP Server API meant to accept queries for the stored data. The Server API is used to display the data in a dashboard or a Web UI.

These three components together are the ones behind that scene that helps keep our K8s clusters healthy and perform the best.
Also Check: Our blog post on Kubernetes LivenessProbe. Click here
How does Prometheus work with Kubernetes?
Prometheus on Kubernetes monitors a ‘thing’, for instance, Linux/Windows server, an application, Apache server, service like a database. These are called the Targets.

Working of Prometheus
Metrics
The units monitored from these targets can be like the current CPU usage, memory usage, the number of counts of a request or an exception. These units are called Metrics. They are in a human-readable text-based format with TYPE and HELP attributes. The HELP attributes description of what the metrics are.
There are three types of metrics TYPES named:
- Counter: Tells us about how many times ‘x’ happened. It can be like the number of times an exception occurred or the number of requests.
- Gauge: It represents a metric that can go up and down. So, it gives us the value of ‘x’. An ‘x’ can be the current CPU usage, disk usage etc.
- Histogram: This type tracks the duration or the size of requests or any required metric.
Prometheus on Kubernetes pulls metrics data from the targets. They pull data from HTTP endpoints like the host address/metrics. So, for this to work, the targets should expose their /metrics endpoint, and the data at the endpoint must be acceptable by Prometheus. But, not every service exposes their /metrics endpoint by default. So, then comes the Exporter. It is a script that does help the Prometheus server retrieve the metrics by doing the following work:
- Pulls the metrics from the target.
- Converts it into the Prometheus readable format.
- Exposes the /metrics endpoints.
So, these exporters help you scrape metrics when required and are readily available. There are many official Prometheus exporters for services like MySQL, Linux server, cloud platforms, etc. You can check it out from here 👈
Alerts Manager
The Prometheus has another component that alerts in a failure in the cluster, resource limitations etc. The Alert Manager is responsible for firing alerts via a different medium like Slack, email, etc.
Prometheus Data Storage
Prometheus on Kubernetes collects and aggregates all the data in a disk. So, it involves local storage but can also connect with remote storage. But we can’t directly store the pulled data on a relational database since it is in a custom time-series format.
Prometheus Querying
Once the data gets stored in the database, we can query the data using PromQL. The Prometheus web UI, Grafana are the tools that help us visualise data.
Most of the monitoring mechanisms like Amazon Cloud Watch pushes the data to a centralised collection platform. But, this doesn’t seem ideal for microservices because of the traffic it might cause. Hence, the Prometheus uses the pull system from which retrieves data via multiple Prometheus instances and helps better detect a status of a service. However, Prometheus offers the push mechanism for ‘short-lived jobs’.
Check Out: Our blog post on Kubernetes Operator Tutorial. Click here
What is Grafana?
Grafana is an open-source mighty visualisation and analytics software. It helps us visualise massive amounts of data with the help of an excellent customisable dashboard. Therefore it helps us study, monitor, and analyse data over a period of time. It connects with a lot of data source like Prometheus, Graphite, Influx DB, ElasticSearch etc.
Features of Grafana
- The Dashboard: It is quite an excelling feature with well equipped and continually evolving part. The dashboard helps us make sense of complex data.
- Alerts: The alerts can be set up and fired whenever there is an anticipated situation.
- Native Support: It has native support of around a dozen databases.
- Built-in Support: It offers built-in support for Prometheus, Influx DB, CloudWatch, Graphite, ElasticSearch.
Also Check: Our blog post on Kubernetes Configmap. Click here
Install Prometheus and Grafana on Kubernetes
So, we finally have arrived at the most exciting part of the blog. Yes, we are going to install Prometheus Kubernetes with a Grafana web UI. But, before we get started, let’s look at some of the prerequisites.
i) You should have a Kubernetes cluster up and running. It can be of any number of nodes, minikube cluster would also do.
If you don’t have one, check out how to create a three-node Kubernetes cluster. But, don’t forget to get back here 😉
ii) Helm package manager should be installed on your machine or the Kubernetes cluster. If not, don’t worry. We got you all covered. You can install from the below commands.
For Linux:
  curl https://baltocdn.com/helm/signing.asc | sudo apt-key add -
  sudo apt-get install apt-transport-https --yes
  echo "deb https://baltocdn.com/helm/stable/debian/ all main" | sudo tee /etc/apt/sources.list.d/helm-stable-debian.list
  sudo apt-get update
  sudo apt-get install helm
For Windows:
choco install kubernetes-helmFor macOS:
brew install helmFrom pkg (FreeBSD):
pkg install helmStep 1: Add repositories
Add the following helm repositories by the commands below.
helm repo add prometheus-community https://prometheus-community.github.io/helm-charts
helm repo add stable https://charts.helm.sh/stable
Step 2: Update Helm repositories
After we add the helm repositories, we have to update the helm repo by the following command.
helm repo update
Step 3: Install Prometheus Kubernetes
helm install prometheus prometheus-community/kube-prometheus-stack
Step 4: Kubernetes Prometheus Port Forward
kubectl port-forward deployment/prometheus-grafana 3000
Step 5: Log in to Grafana
Open your favourite browser and open localhost:3000. Since you are logging in for the first time, you will have to use a default username and password. However, you can create new users and update passwords later. Use the default credentials for now:
username: admin
password: prom-operator

Once you are inside the Grafana web UI, there are a lot of things you can do. You can set the duration of scraping metrics. You can also configure your dashboard. Also, you can look into networking. However, there are a lot more things to explore in this. I am adding some of the scouting done by me below.
Networking in a pod:

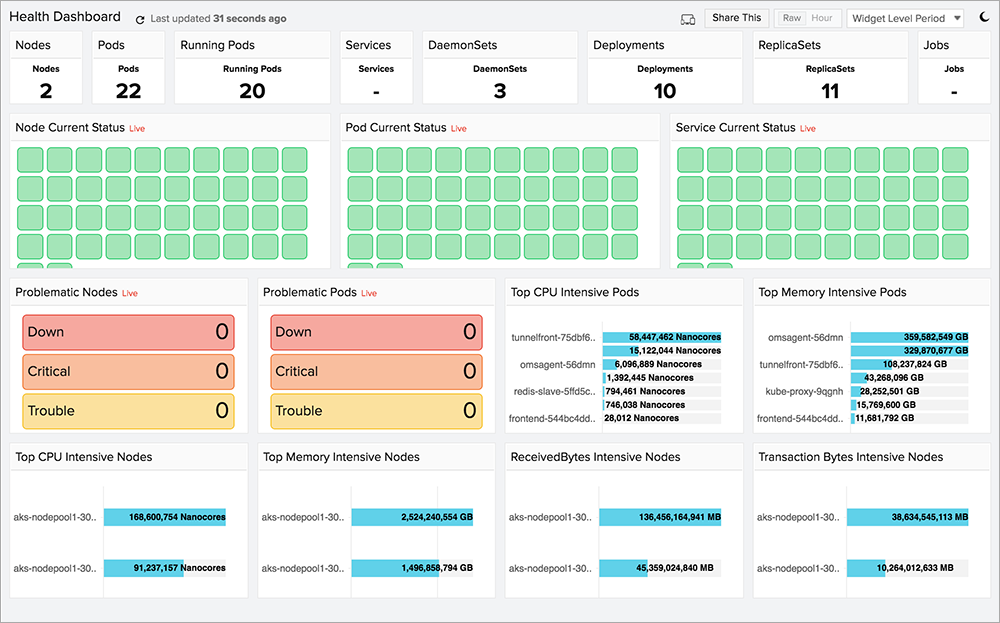
Cluster Status:

Conclusion
Monitoring is crucial whether you are experimenting or using the production-based cluster. Prometheus Kubernetes monitoring with Grafana is a boon for us indeed. It makes our lives a lot easier with a customisable interface, configurable exporters. Also, it is open-source. However, K8s has its official dashboard, and the Prometheus + Grafana is no match.
We have used Helm to deploy the Prometheus operator, including all the necessary tools for Prometheus and Grafana to monitor the cluster. So, you would have figured out why Prometheus and Grafana for Kubernetes are a superpower. If no yet, I suggest you install the Prometheus and Grafana on Kubernetes and have a look at the various features it has to offer for us!
Related Post
- Kubernetes for Beginners
- Kubernetes Operator: An Overview, Stateful Application Example
- How To Setup A Three Node Kubernetes Cluster For CKA: Step By Step
- Certified Kubernetes Administrator (CKA) Certification Exam
- Certified Kubernetes Administrator (CKA) Certification: Step By Step Activity Guides/Hands-On Lab Exercise